Methods
China PM2.5 10km prediction model >
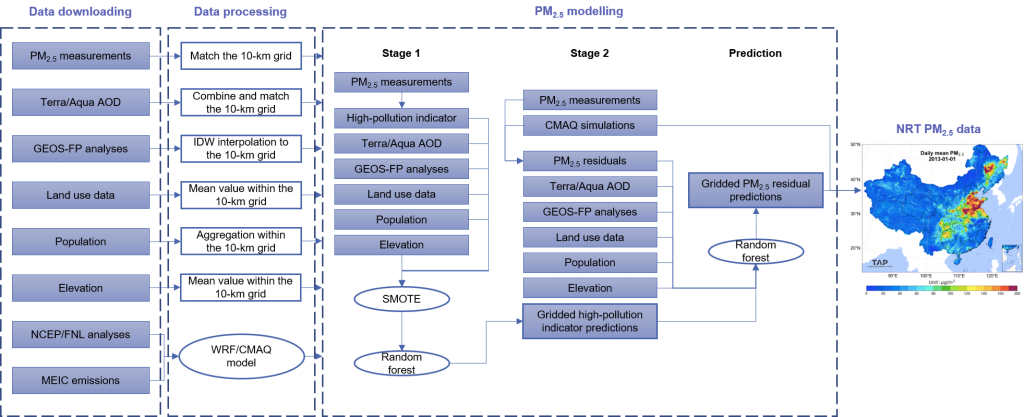
TAP developed a two-stage machine learning model to predict daily PM2.5 concentrations with complete spatial coverage. The structure of our model is shown below. The data sources include PM2.5 measurements, satellite AOD (aerosol optical depth) retrievals, online CMAQ simulations, meteorological reanalysis data, land use information, and population distribution. The first-stage model predicts the high pollution events and employed the SMOTE algorithm to resample the model training data, thus balanced the proportion of high pollution events and normal events in the model training dataset. The first-stage random forest model trained with the resampled data predicts high pollution events. The second-stage model predicts the residual between CMAQ PM2.5 simulations and PM2.5 measurements with random forest. The prediction of residual rather than the prediction of PM2.5 enlarged the response of predictions to variations in predictors, thus improved the prediction accuracy. The missingness in satellite retrievals was filled by decision-tree based modeling algorithm.
References:
- Geng, G., Xiao, Q., Liu, S., Liu, X., Cheng, J., Zheng, Y., Xue, T., Tong, D., Zheng, B., Peng, Y., Huang, X., He, K., & Zhang, Q. (2021). Tracking Air Pollution in China: Near Real-Time PM2.5 Retrievals from Multisource Data Fusion. Environ Sci Technol, 55, 12106-12115. [Link] [PDF]
- Xiao, Q., Zheng, Y., Geng, G., Chen, C., Huang, X., Che, H., Zhang, X., He, K., & Zhang, Q. (2021). Separating emission and meteorological contribution to PM2.5 trends over East China during 2000–2018. Atmos Chem Phys, 21, 9475-9496. [Link] [PDF]
- Xiao, Q., Geng, G., Cheng, J., Liang, F., Li, R., Meng, X., Xue, T., Huang, X., Kan, H., Zhang, Q., & He, K. (2021). Evaluation of gap-filling approaches in satellite-based daily PM2.5 prediction models. Atmos Environ, 244, 117921. [Link] [PDF]
China PM2.5 species 10km prediction model >
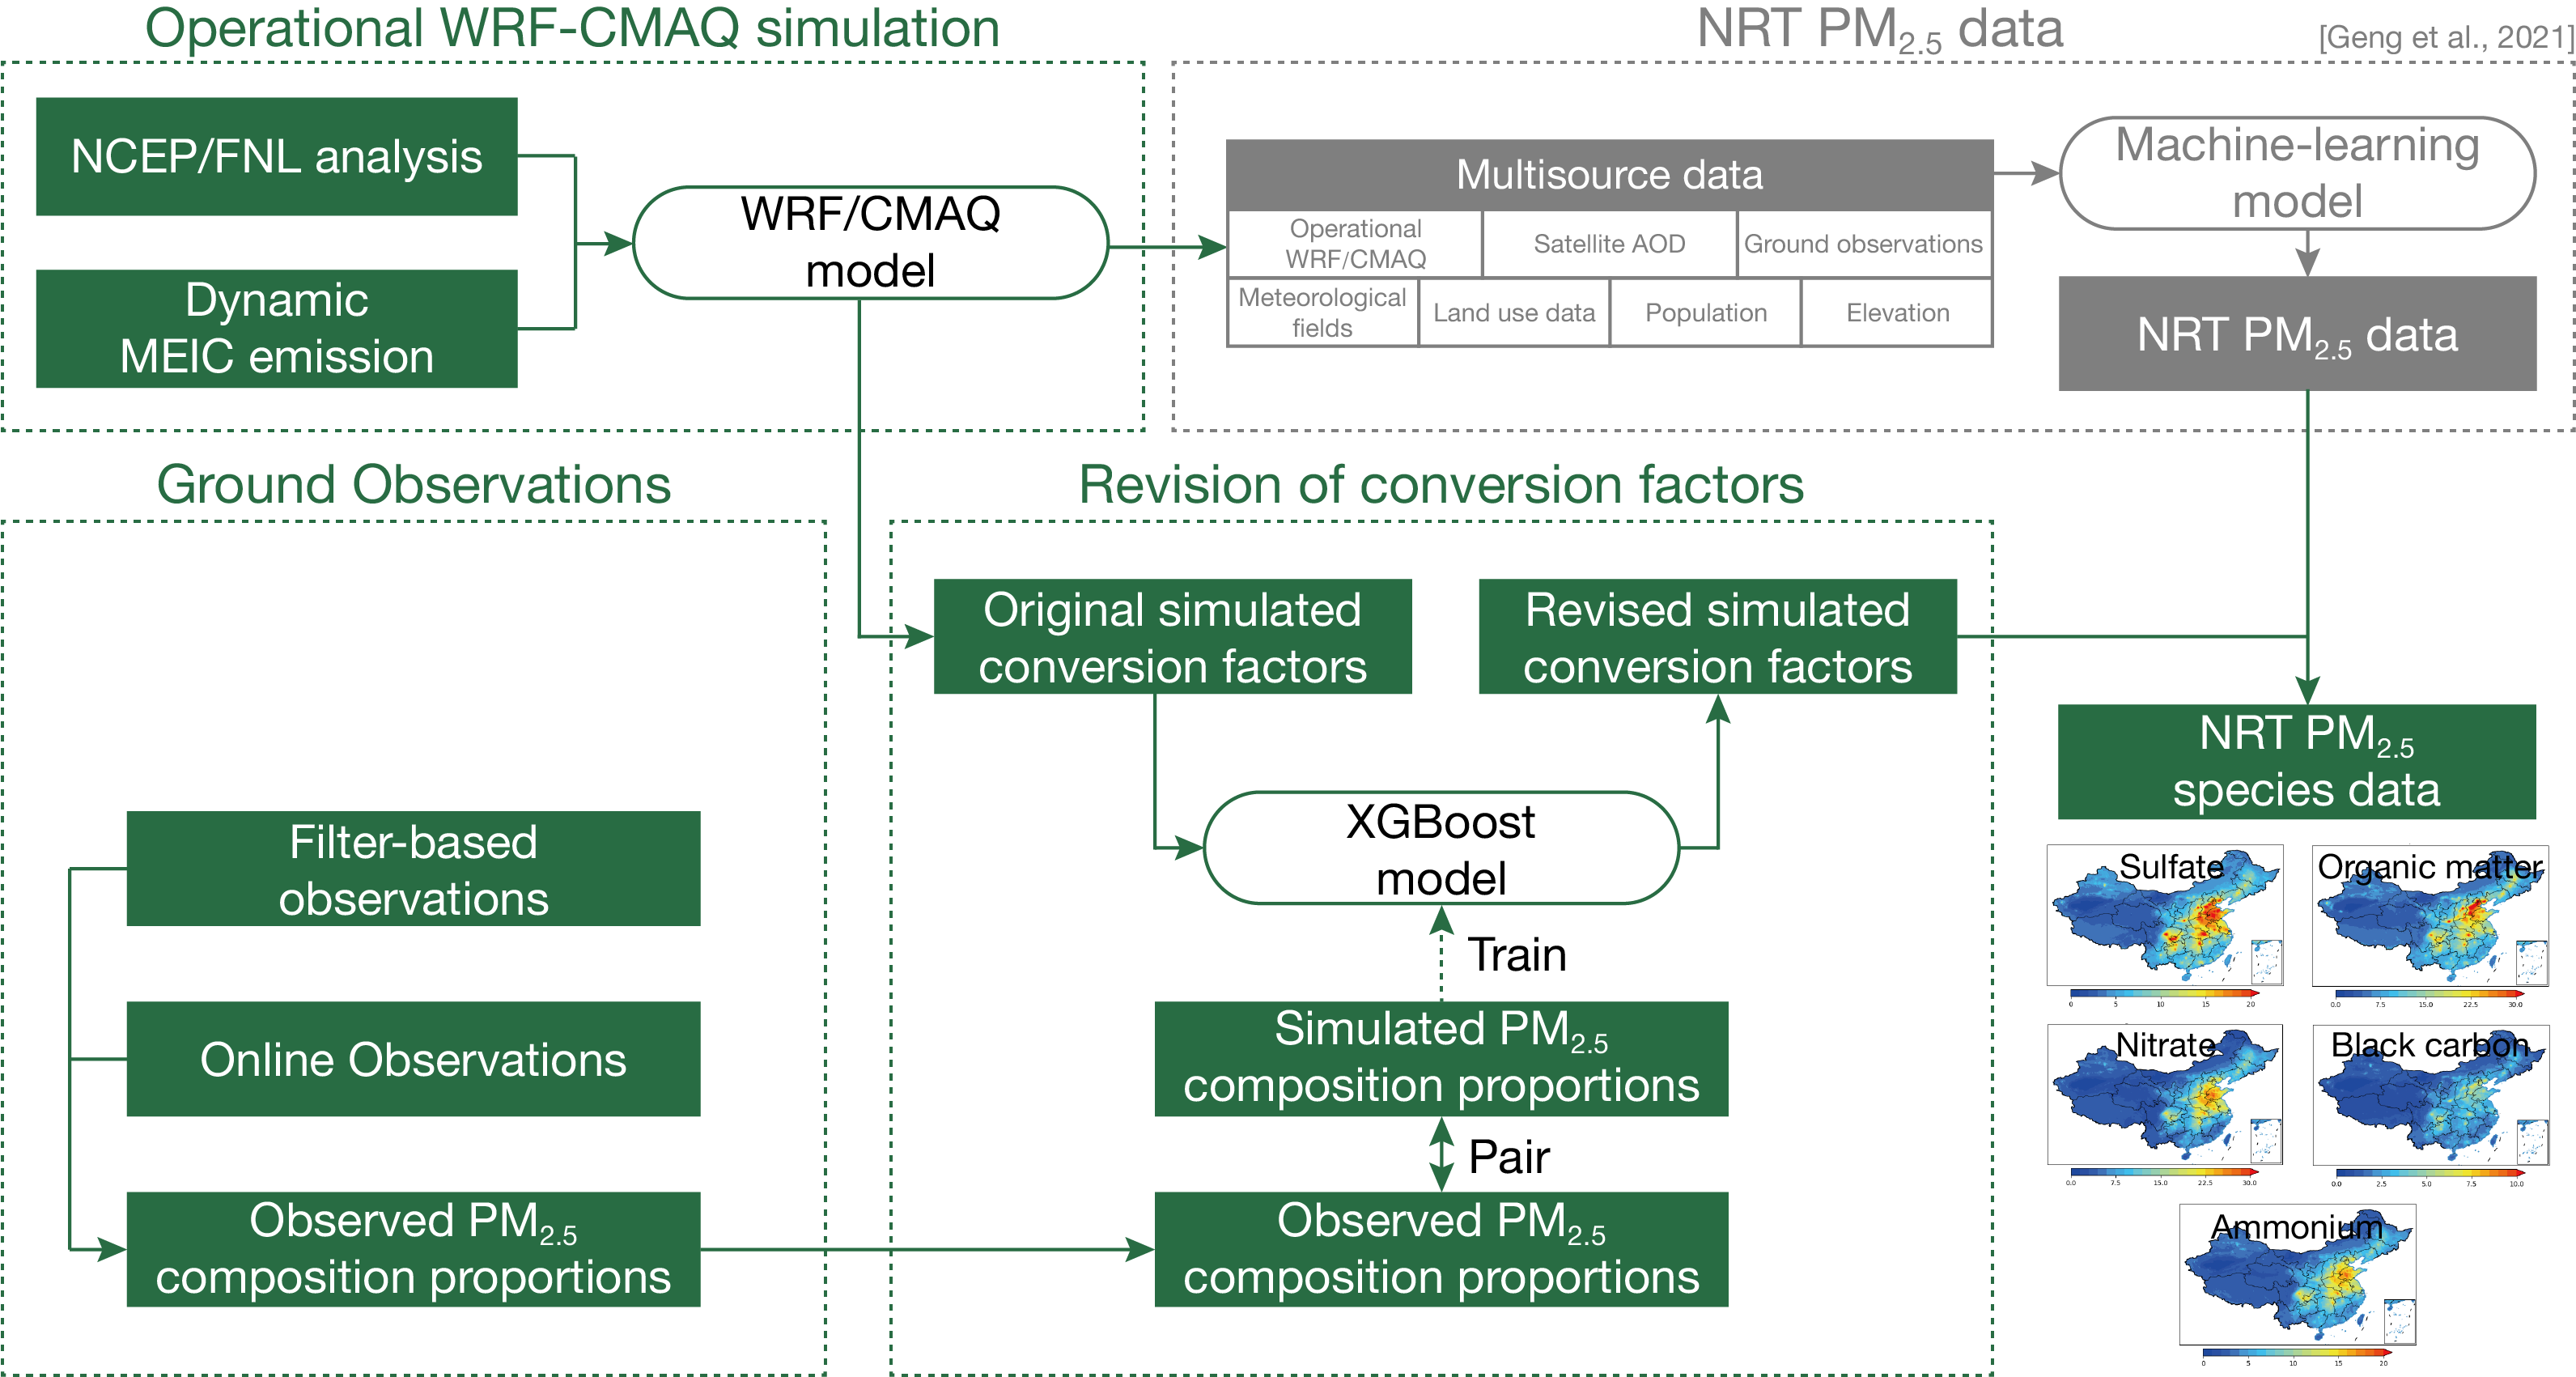
TAP developed PM2.5 species concentrations data set based on the published 10km PM2.5 concentrations with complete spatial coverage. The methodology framework is shown below. The model extract PM2.5 species information from operational CMAQ simulations under the constraint of PM2.5 concentrations. To correct the bias of the CMAQ simulations, TAP first improved the windblown dust module, and then trained models to revise simulated PM2.5 species proportions based on ground measurements and extreme gradient boosting (XGBoost) algorithm. Having obtained more accurate PM2.5 species conversion factors, PM2.5 species concentrations were derived on the basis of PM2.5 data. The TAP-released PM2.5 species data include sulfate (SO42-), nitrate (NO3-), ammonium (NH4+), organic matter (OM), and black carbon (BC).
References:
- Geng, G., Zhang, Q., Tong, D., Li, M., Zheng, Y., Wang, S., & He, K. (2017). Chemical composition of ambient PM2.5 over China and relationship to precursor emissions during 2005–2012. Atmos Chem Phys, 17(14), 9187-9203. [Link][PDF]
- Liu, S., Geng, G., Xiao, Q., Zheng, Y., Liu, X., Cheng, J., & Zhang, Q. (2022). Tracking daily concentrations of PM2.5 chemical composition in China since 2000. Environ Sci Technol, 56, 16517–16527. [Link][PDF]
China PM2.5 1km prediction model >
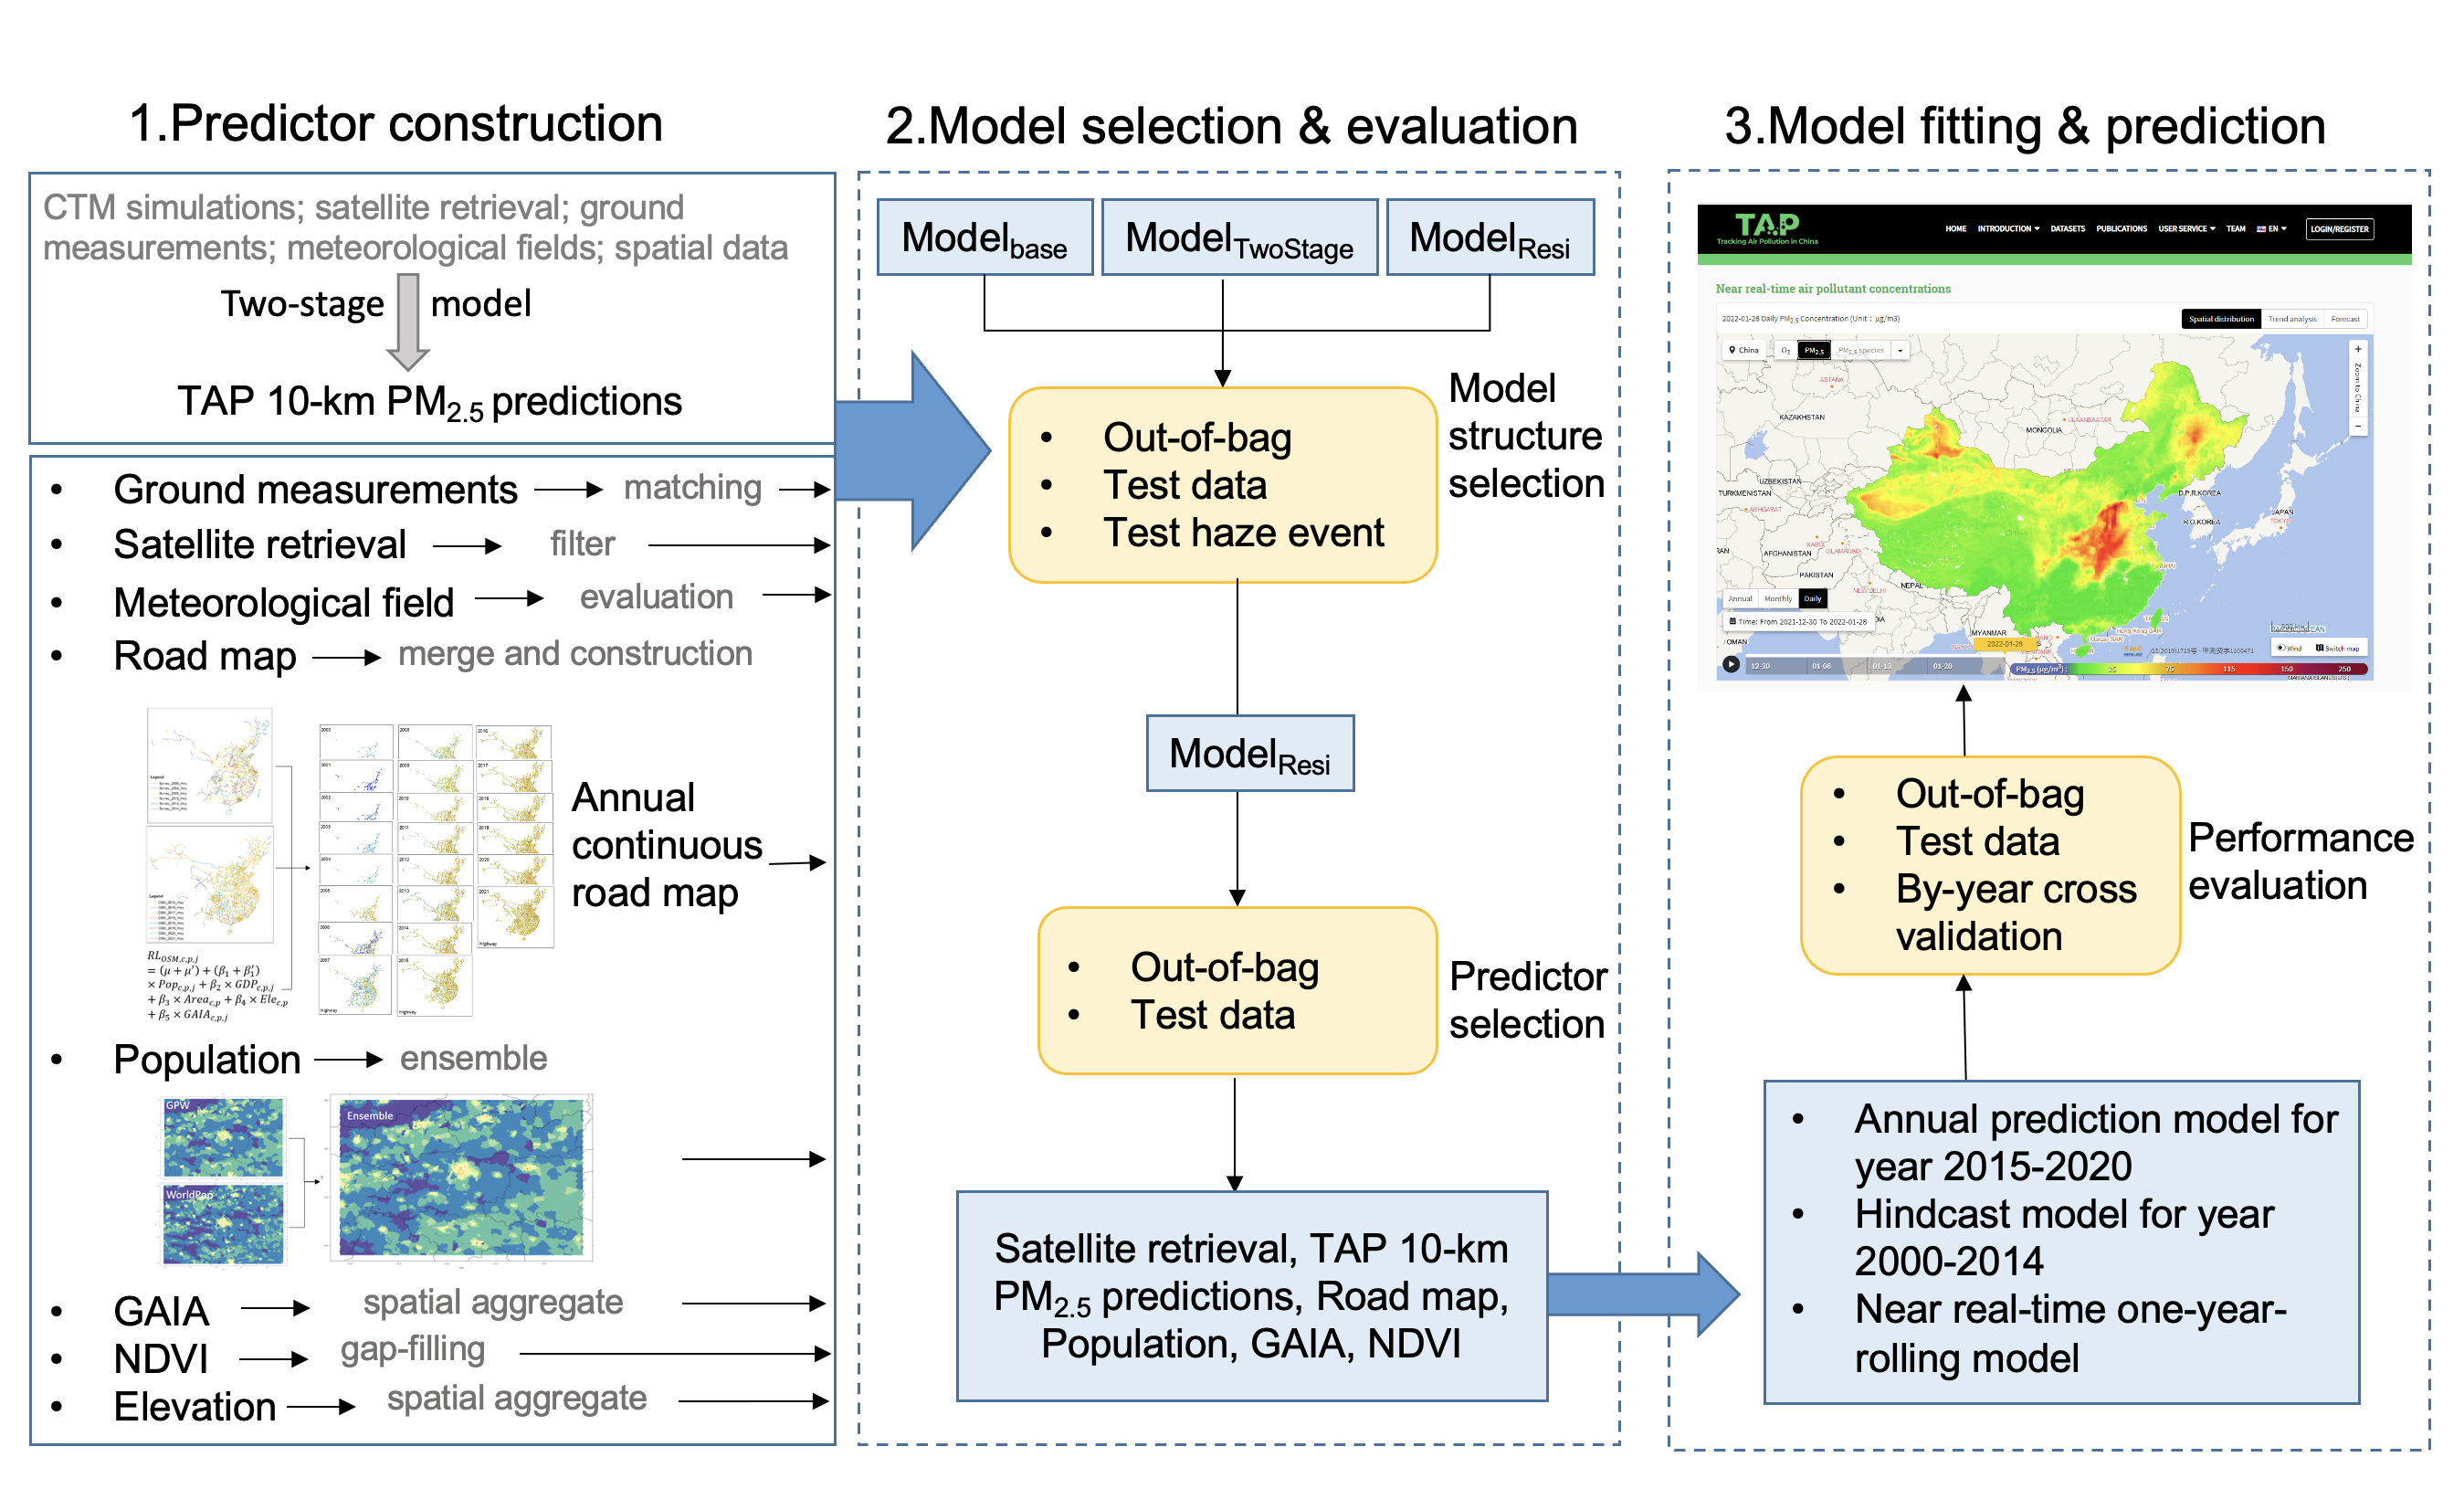
With the TAP PM2.5 at 10km resolution, the complete-coverage daily PM2.5 predictions at 1km spatial resolution from 2000 to the present were produced by fusing high-resolution satellite remote sensing retrievals and environmental spatial data (e.g. road maps) with a machine learning model. The structure of our model is shown below. To correctly reflect the temporal variations in land cover characteristics that significantly affected the pollution emissions, continuous annual geoinformation datasets, including the annual road distribution maps and ensemble gridded population distribution maps in China were constructed by spatial and statistical models. Then the random forest model was trained by the residual between 10km TAP PM2.5 predictions and PM2.5 measurements in order to enlarge the response of predictions to variations in predictors.
References:
- Xiao, Q., Geng G., Liu, S., Liu, J., Meng, X., & Zhang, Q. (2022). Spatiotemporal continuous estimates of daily 1 km PM2.5 from 2000 to present under the Tracking Air Pollution in China (TAP) framework. Atmos Chem Phys, 22, 13229–13242. [Link][PDF]
China O3 prediction model >
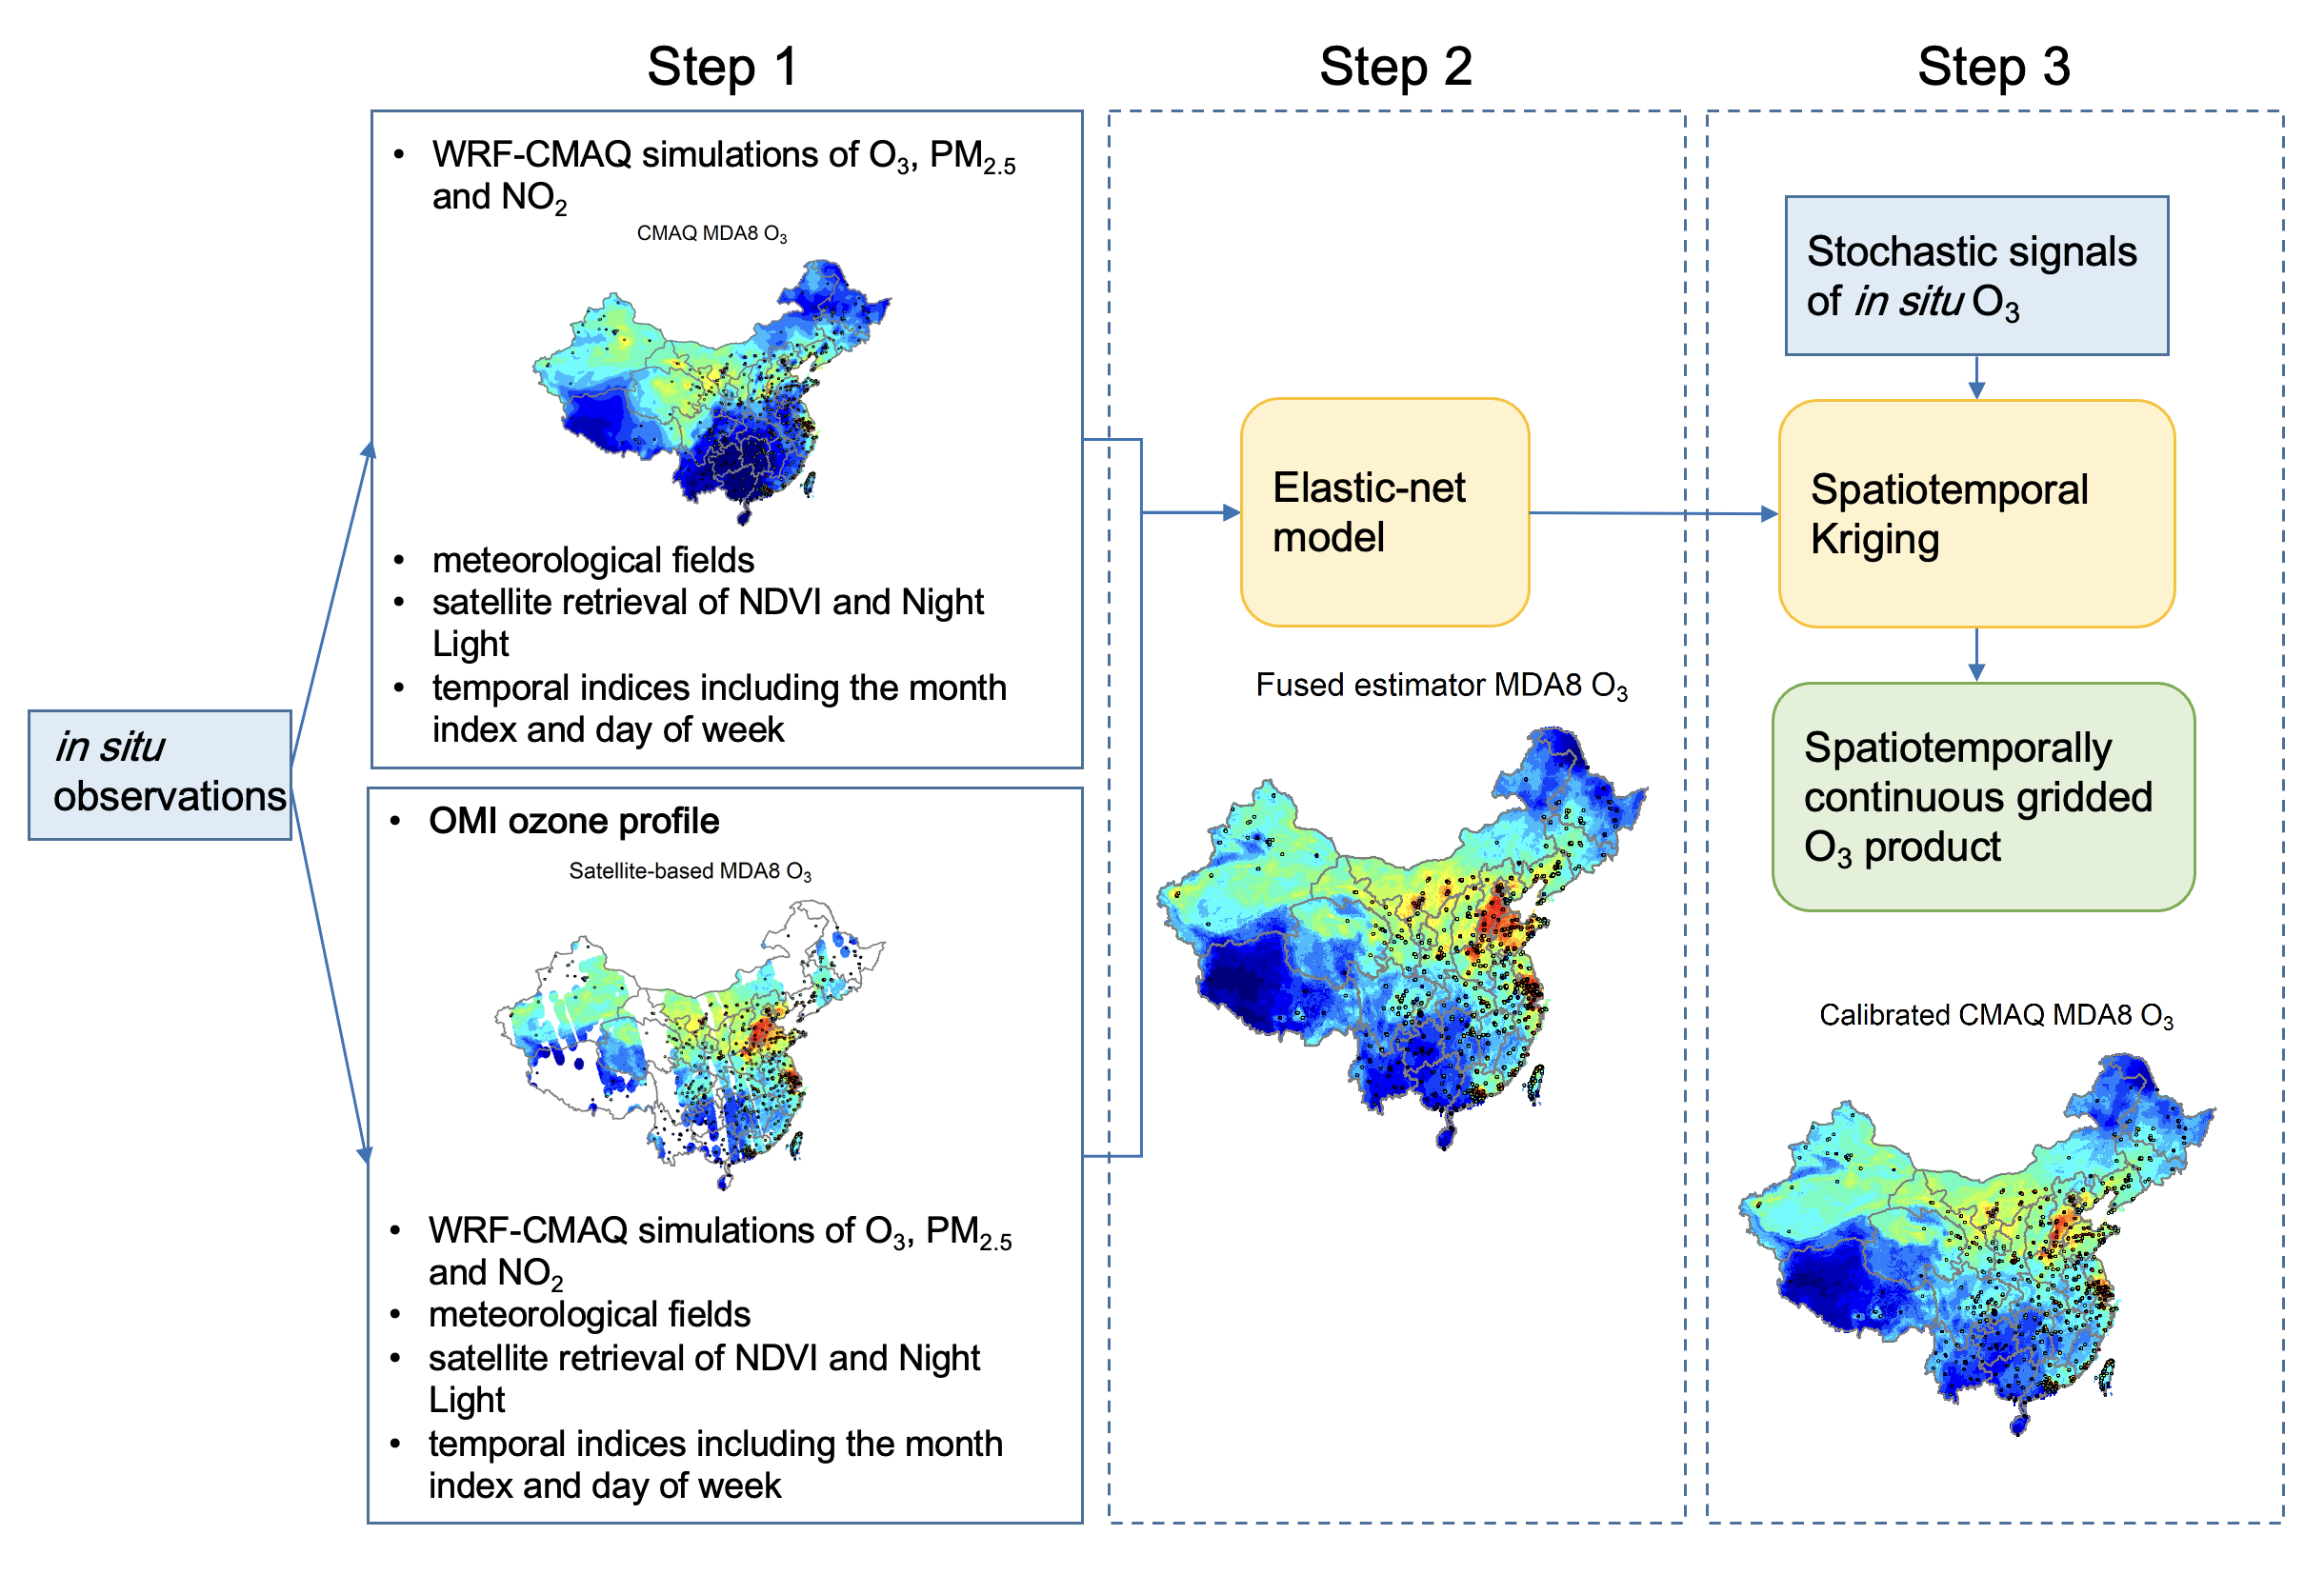
TAP developed a machine learning model to predict full-coverage daily maximum 8-h average O3 concentrations by fusing data from multiple sources. The model structure is shown below. The predictors include O3 measurements, satellite O3 vertical distribution profile, CMAQ simulations, WRF meteorological simulations, Normalized Difference Vegetation Index (NDVI), night light and population distribution. First, two random forest model were developed to describe the associations between O3 measurements and all the predictors, with and without the satellite O3 vertical distribution profile. Due to the missingness in satellite retrievals, the predictions from the model with satellite retrievals were spatiotemporally discontinuous. Then an elastic-net model was developed to fuse the predictions from the two random forest model in order to improve the prediction accuracy as well as fill the missingness. The last step simulate the residual of the fused predictions with a spatiotemporal Kriging interpolation.
Reference
- Xue, T., Zheng, Y., Geng, G., Xiao, Q., Meng, X., Wang, M., Li, X., Wu, N., Zhang, Q., & Zhu, T. (2020). Estimating spatiotemporal variation in ambient ozone exposure during 2013–2017 using a data-fusion model. Environ Sci Technol, 54, 14877-14888. [Link] [PDF]
- Xiao, Q., Geng, G., Xue, T., Liu, S., Cai, C., He, K., & Zhang, Q. (2021). Tracking PM2.5 and O3 Pollution and the Related Health Burden in China 2013–2020. Environ Sci Technol. [Link][PDF]
Global PM2.5 and fire PM2.5 - 10km>
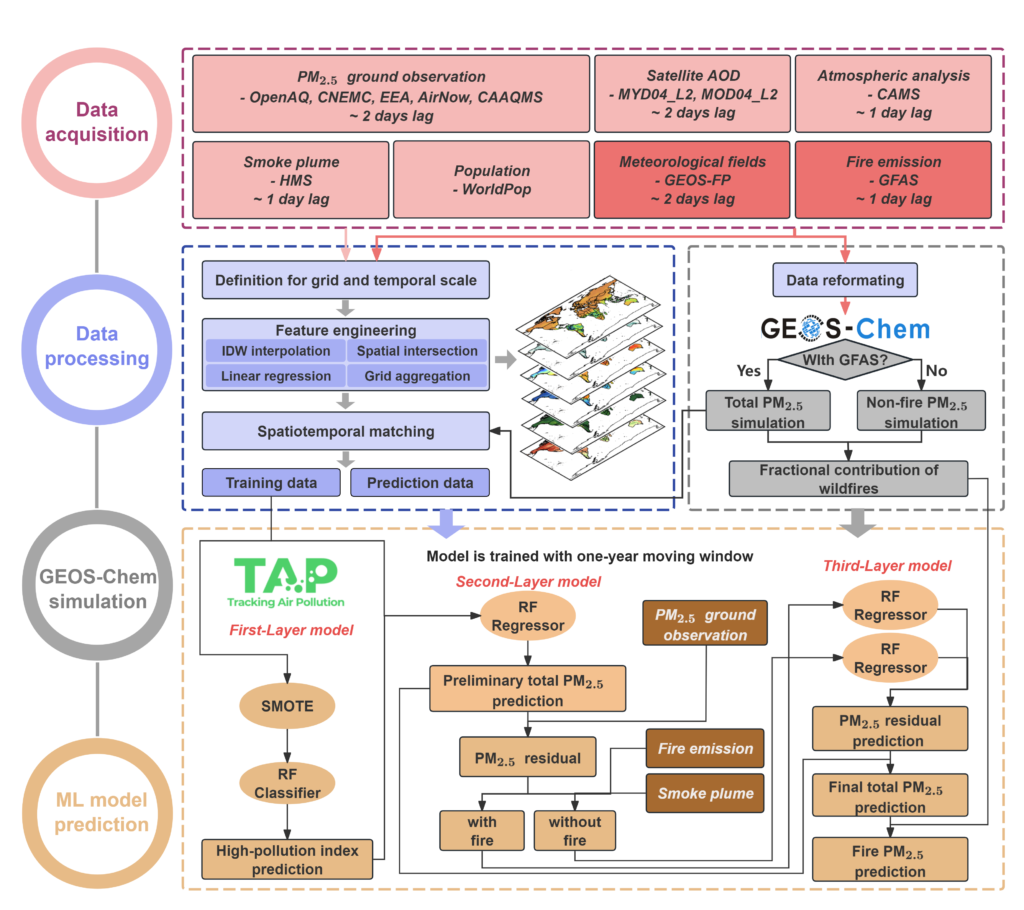
First, global high-resolution wildfire emission inventories are used to drive the GEOS-Chem model, to quantify the relative contribution of wildfire emissions to the PM2.5 concentration. Meanwhile, by incorporating multiple sets of ground observation data, reanalysis data, satellite observations, and wildfire emission data, a three-layer machine learning model is developed using random forest, SMOTE, and residual correction techniques. Further, through operational data preprocessing, GEOS-Chem simulation, and rolling training of the machine learning model, global near-real-time daily PM2.5 and fire PM2.5 at 10km resolution are retrieved synchronously.
Reference
- Zhang, Q., Wang Y., Xiao Q., Geng G., S. J. Davis, Liu,X., J. Yang, J. J. Liu, W. Y. Huang, C. P. He, B. H. Luo, R. V. Martin, M. Brauer, J. T. Randerson, and K. B. He (2025), Long-range PM2.5 pollution and health impacts from the 2023 Canadian wildfires. Nature. [Link]
AI-GAMFS >
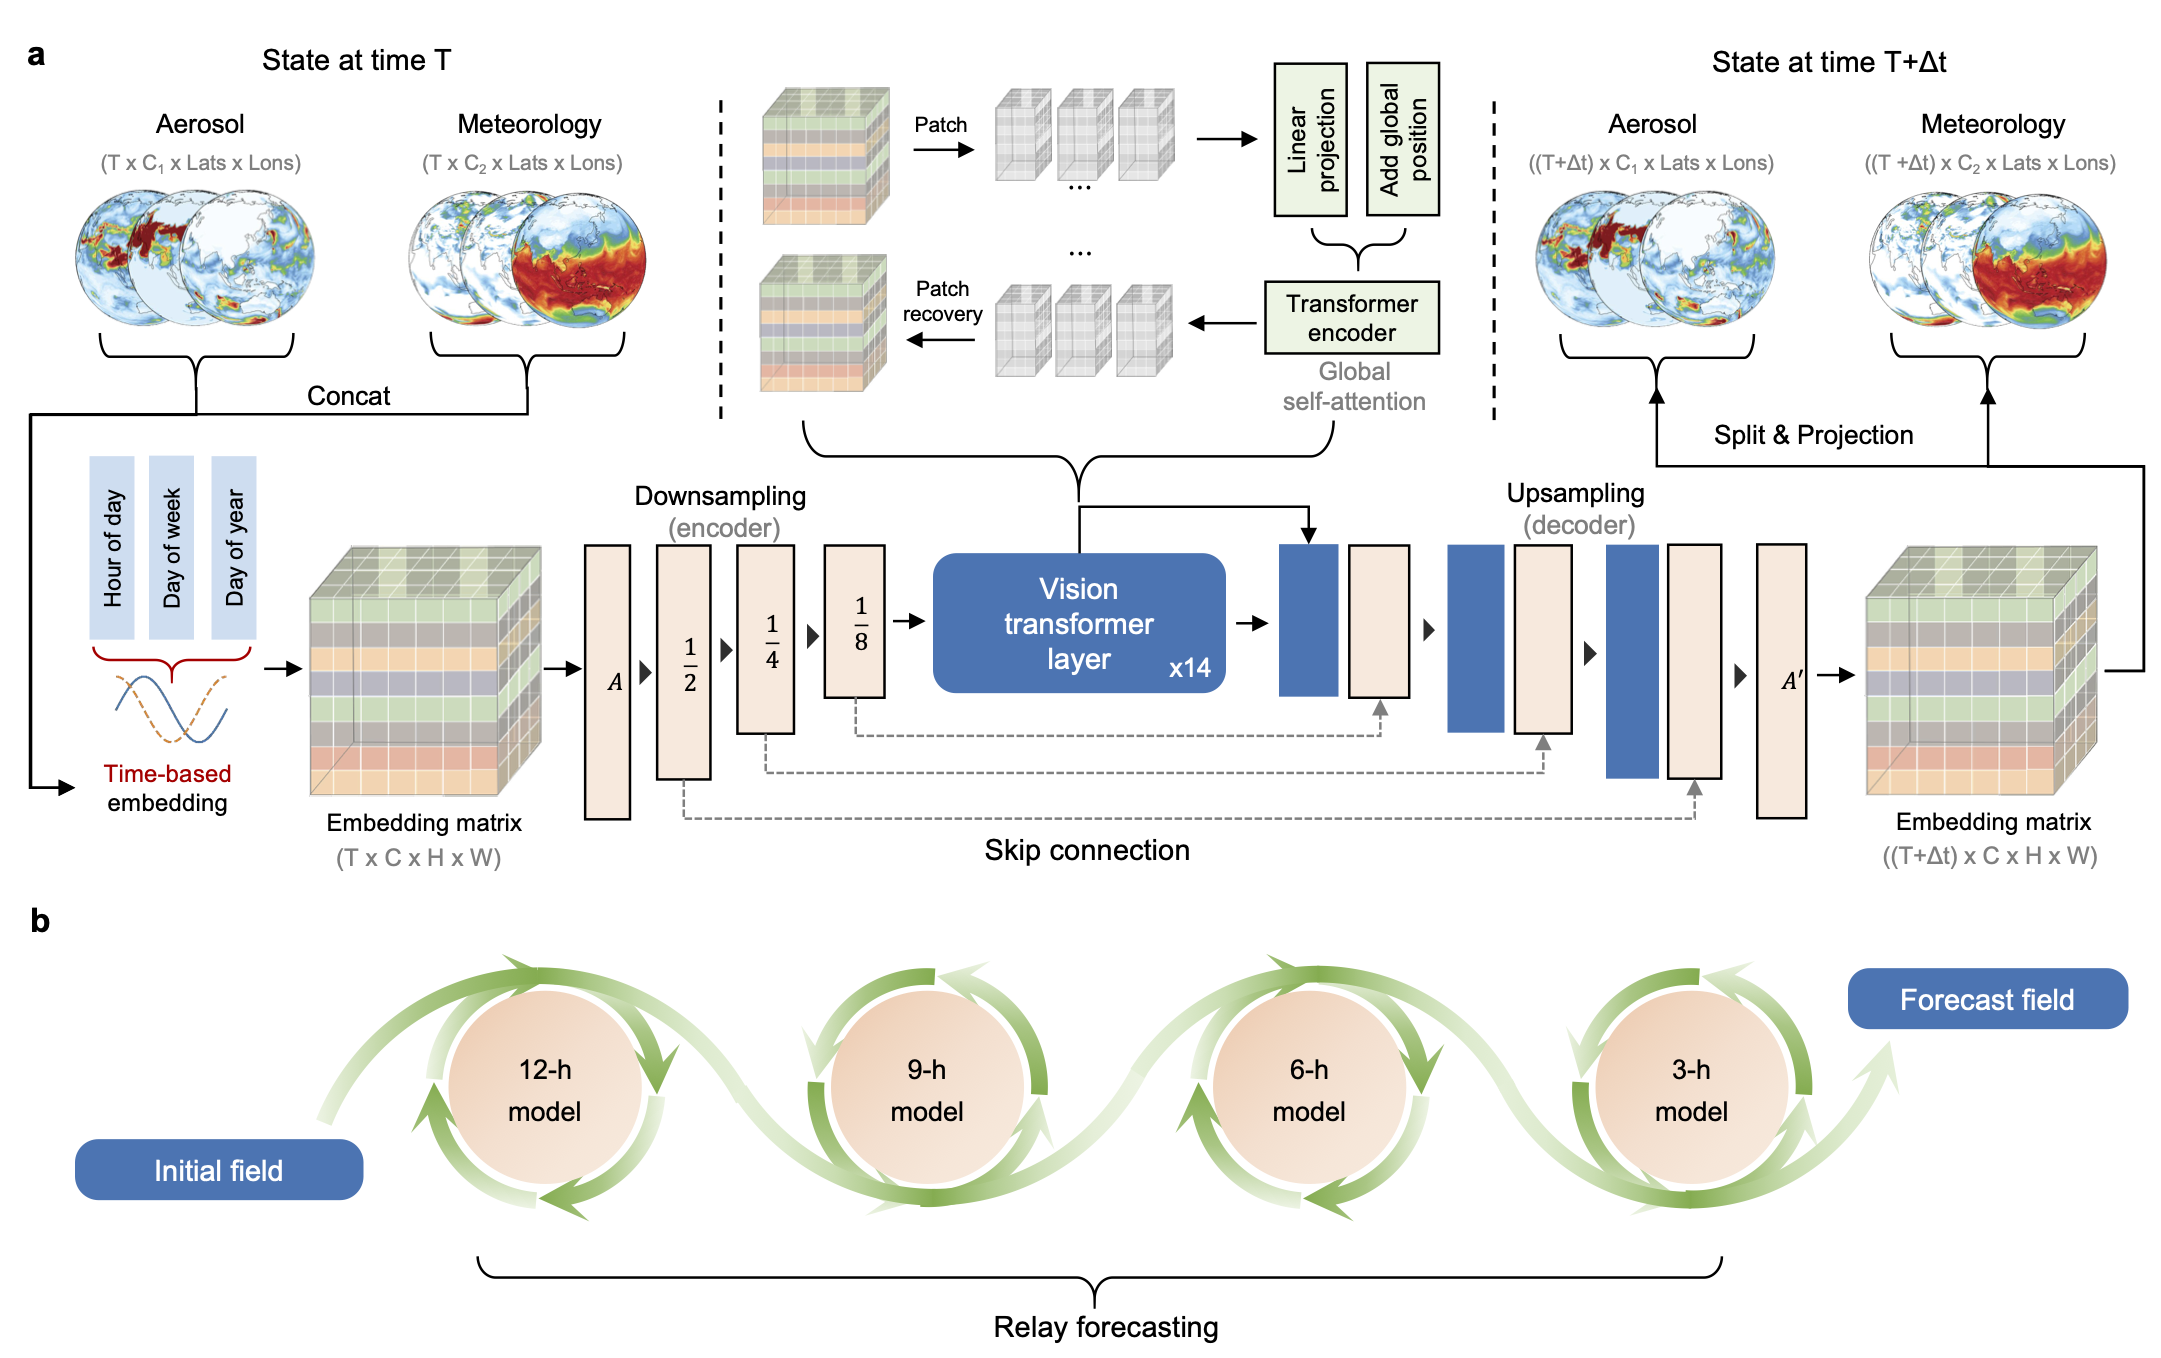
A Machine-learning-driven Global Aerosol-Meteorology Forecasting System(AI-GAMFS), developed by the Chinese Academy of Meteorological Sciences, has been operationally deployed on the TAP platform. With 1.3 billion parameters, the model employs an innovative architecture that combines Vision Transformer (ViT) and U-Net networks. By integrating key technologies such as global attention mechanisms, spatiotemporal encoding modules, and relay forecasting strategies (as detailed in the following technical roadmap), AI-GAMFS effectively captures complex aerosol-meteorology interactions, significantly enhancing high-dimensional environmental-meteorological feature extraction capabilities. Trained on a 42-year advanced global aerosol reanalysis dataset and initialized with GEOS-FP (GEOS Forward Processing) analysis data, AI-GAMFS delivers rapid and efficient forecasting. It performs 8 daily rolling forecasts, each requiring only 36 seconds on a single GPU. The system provides 5-day global forecasts at 3-hour intervals for key aerosol components (dust, sulfate, black carbon, organic carbon, and sea salt), along with their optical properties, surface concentrations, and related meteorological variables. Covering 54 forecast variables at a 0.5°× 0.625° resolution, AI-GAMFS substantially enhances operational efficiency and timeliness in global aerosol-meteorology coupled forecasting.
Reference:
- Gui, K., Zhang, X., Che, H., Li, L., Zheng, Y., An, L., Miao, Y., Zhao, H., Dubovik, O., Holben, B., Wang, J., Gupta, P., Lind, E S., Toledano, C., Wang, H., Wang, Z., Wang, Y., Huang, X., Dai, K., Xia, X., Xu, X., & Zhang, X. (2026). Advancing operational global aerosol forecasting with machine learning. Nature. [Link]